The ei23 Dashboard / Supervisor
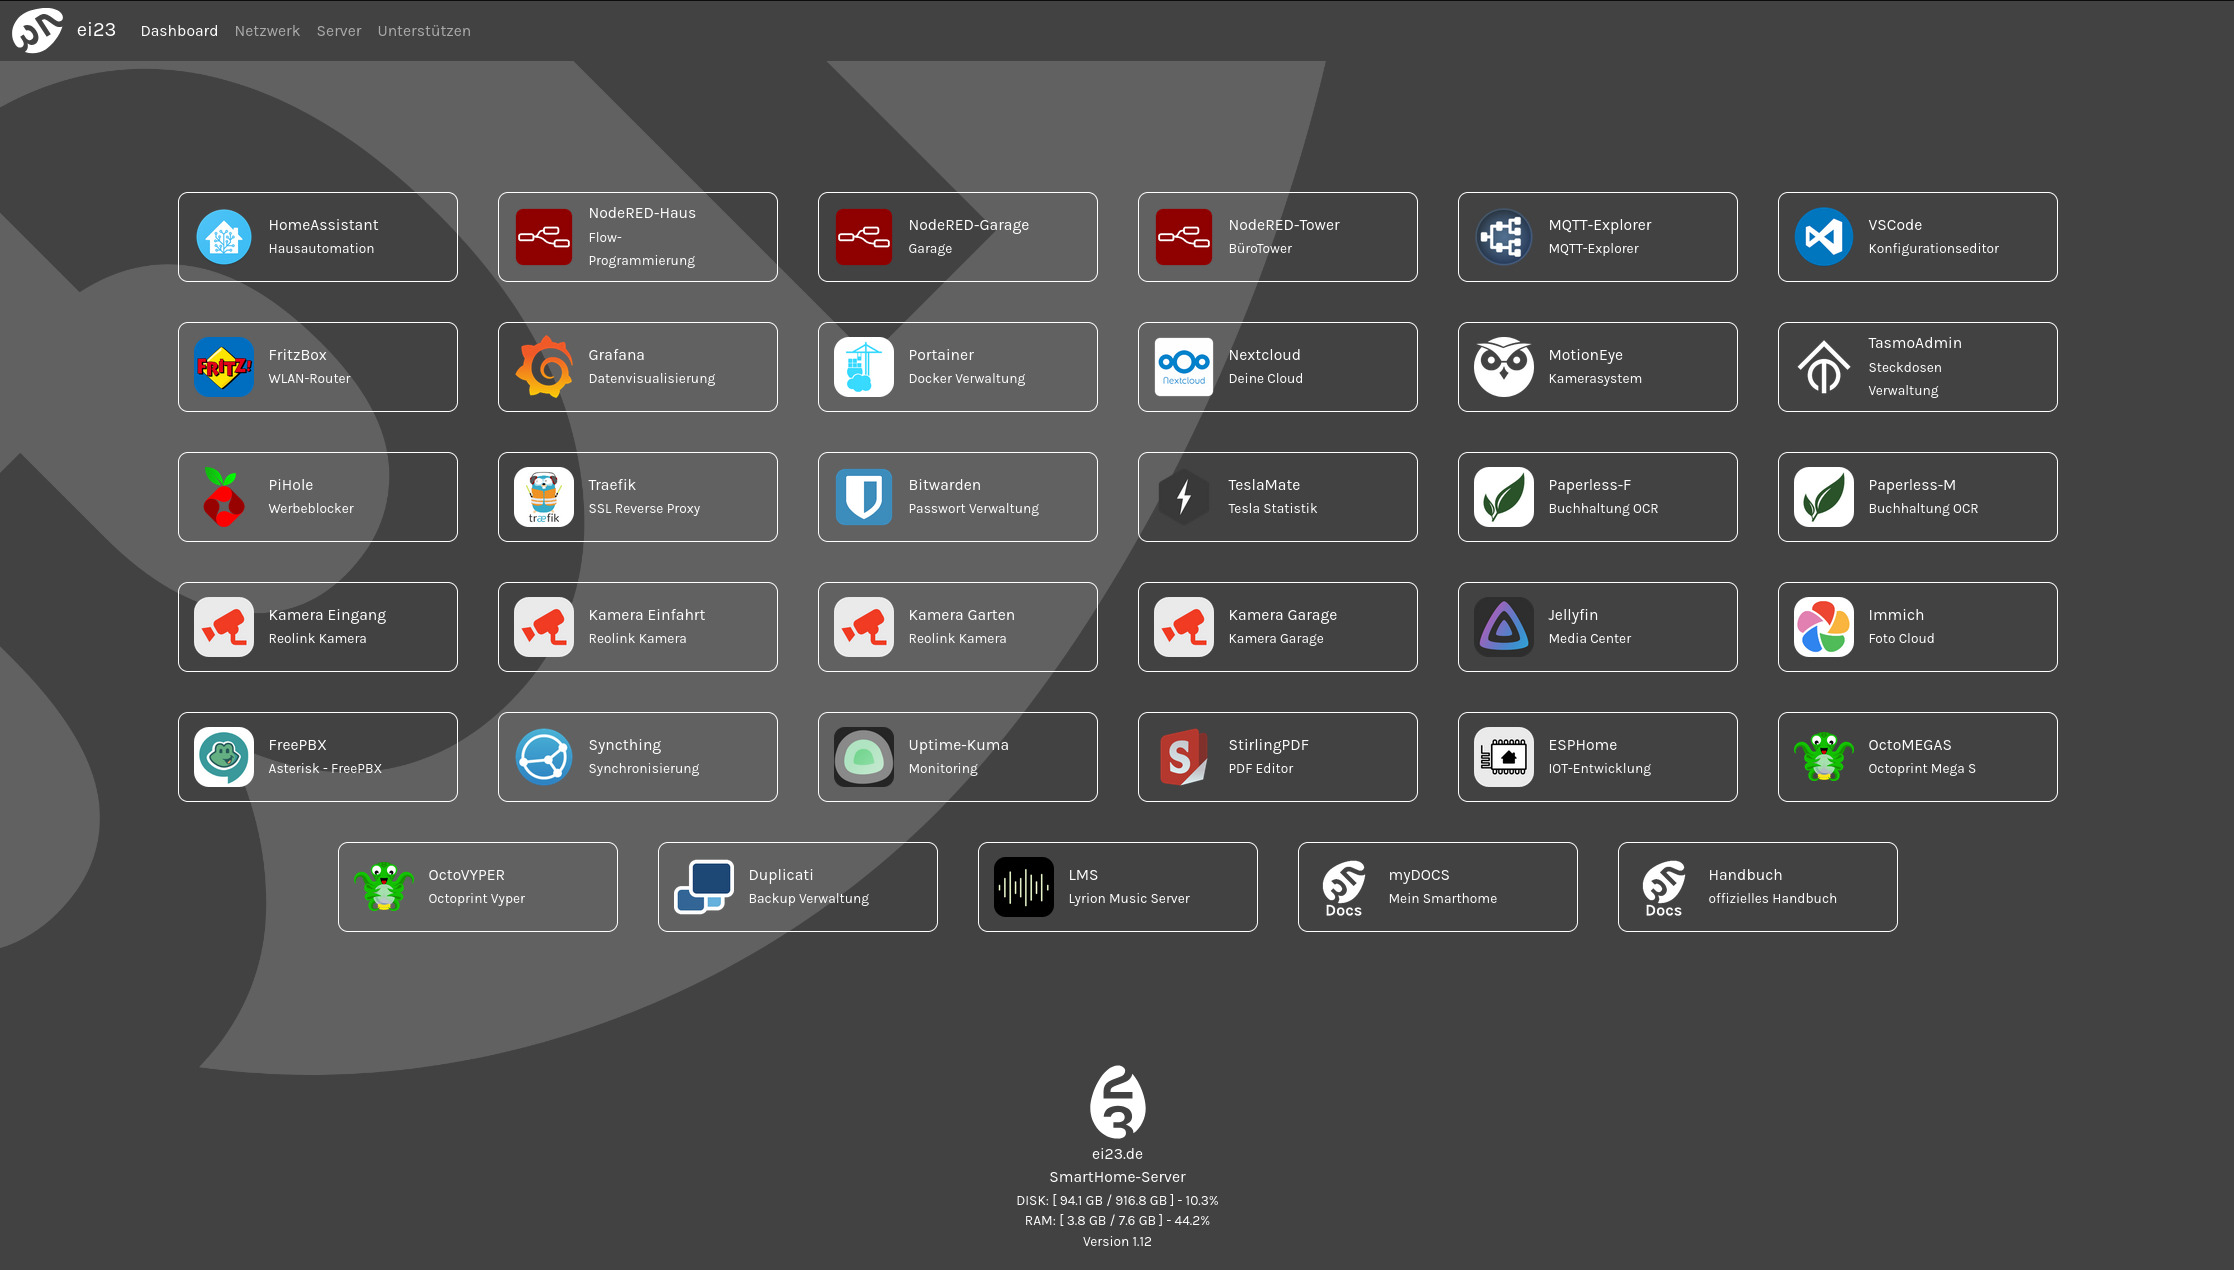
The ei23 Dashboard is more than just a display - it's a full server supervisor. It offers live monitoring, a program editor, template management, and server actions with real-time terminal output.
Overview
The dashboard consists of four main pages:
| Page | URL | Description |
|---|---|---|
| Dashboard | / | Program overview with icons |
| Network | /localnet | Network scanner |
| Server | /server | Server administration |
| Storage | /tree | Folder size analysis |
Dashboard Page (/)
The home page displays all active programs as tiles. Each tile is linked and can be opened with a click.
Server Page (/server)
The server page is the heart of the administration:
Live Resource Monitoring
At the top you can see real-time:
- CPU - Current CPU usage in percent
- RAM - Used and total memory
- Disk - Used and total disk space
The bars update automatically every 5 seconds.
Server Actions
With one click you can execute important server commands:
| Action | Description | Command |
|---|---|---|
| 📊 Docker Status | Shows all containers | docker ps -a |
| 🔄 Docker Compose | Starts/restarts all containers | ei23 dc |
| ⬆️ Docker Update | Updates all Docker images | ei23 du |
| 🧹 Cleanup | Deletes unused images | docker image prune -a -f |
| 📄 Build Docs | Builds the documentation | ei23 docs |
| 🏠 HA Addons | Updates Home Assistant addons | ei23 ha-addons |
| 📦 APT Update | Updates system packages | apt-get update && upgrade |
| 🔧 ei23 Update | Updates only the ei23 script | ei23 ei23update |
| 🚀 Full Update | Complete system update | ei23 update |
| ⚡ Reboot | Restarts the server | sudo reboot |
Terminal Output
After starting an action, a terminal window opens with real-time output:
- Auto-Scroll can be toggled on/off
- Error lines are highlighted in red
- Successful lines are highlighted in green
- Warnings are highlighted in cyan
Session Badges
Running actions show an animated dot ● next to the button. After completion, ✓ (success) or ✗ (error) is briefly displayed.
Actions continue running
Server actions continue running even if you leave the page. After returning, you'll see the current status.
Docker Container
All containers from docker-compose.yml are displayed as cards:
| Status | Color | Meaning |
|---|---|---|
| HTTP Available | 🟢 Green | Web interface accessible |
| Host Mode | 🟣 Purple | Host network mode |
| Port Active | 🔵 Blue | Port is open |
| Internal | ⚫ Gray | Internal only |
Click "Scan Containers" to update the status.
Add Docker Programs
The template panel is collapsible (click on the heading):
- Expand the panel
- All available templates are displayed
- Already installed templates are grayed out
- Click "+ Add" to append a template
- Then run "Docker Compose" to start the container
Note
Duplicates and port conflicts can cause errors. Check the docker-compose.yml manually if needed.
Quick Add: put a container on the dashboard
Every container card has a "+ Dashboard" button. One click creates the link with a sensible icon suggestion (img/[service-name].png, otherwise the generic img/app.png), the first host port and active state – the page then jumps to the new entry, where you can still adjust title, icon and port.
If the service is already on the dashboard, the button shows "✓ Dashboard" and jumps to the existing entry when clicked.
Edit Dashboard Links
The program editor offers full control over the dashboard:
Changes are saved automatically
There is no save button anymore: every change (fields, toggles, sorting, adding, deleting, icon selection) is saved automatically after a short delay. On the right of the header you see the status: "Saving…", "✓ Saved" or – if something goes wrong – "⚠ Not saved" with a Retry button.
Add Programs
- Click "+ New"
- Fill in the fields:
- Name* (required)
- Title (subtitle)
- Port (e.g. 8080)
- Icon (e.g.
img/nodered.png) – the button next to it opens the icon picker - Custom URL (optional, overrides port)
- Active (visible in dashboard)
- Click "Add" – it is saved automatically
Icon Picker
Next to every icon field (in the "+ New" dialog and in each program card, where you can also click the icon preview) the image button opens an overview of all icons from web/static/img/. There you can:
- scroll the list or search at the top (e.g.
router,camera,grafana) - apply an icon with one click – a ✓ marks icons that are already used in the dashboard
- still fill in the icon field manually, e.g. for an external URL or your own image
The preview in the picker shows the icons on the dashboard background so that white symbols stay visible.
Edit Programs
- Active/Inactive: Toggle switch
- Fields: Edit directly in the form (saved automatically)
- Sort: Drag & Drop with ⋮⋮ handle
- Delete: ✕ button (with confirmation)
Import Templates
Click "Templates" to add missing programs from programs_templates.json. These are imported as inactive.
Explanation of programs.json
The file is located at /home/[user]/ei23-docker/volumes/ei23/web/static/programs.json
{"programs": [
{"active": true,    "port": "",     "custom_url": "http://10.1.1.11:1880",  "name": "NodeRED",          "title": "Garage",              "img": "img/nodered.png"},
{"active": true,    "port": "4004", "custom_url": "",                       "name": "MQTT-Explorer",    "title": "MQTT-Explorer",       "img": "img/mqtt-explorer.png"},
{"active": false,   "port": "",     "custom_url": "http://10.1.1.12",       "name": "Camera Garden",    "title": "Nice Garden",         "img": "img/camera.png"},
{"active": true,    "port": "3000", "custom_url": "",                       "name": "Grafana",          "title": "Data Visualization",  "img": "img/grafana.png"}
]}
"http://10.1.1.11:1880"is a Custom URL - can also be an external address- Without Custom URL, the port is combined with the IP address (e.g.
http://10.1.1.2:4004) "active": falsehides the entry- The last element must not have a comma at the end
Network Page (/localnet)
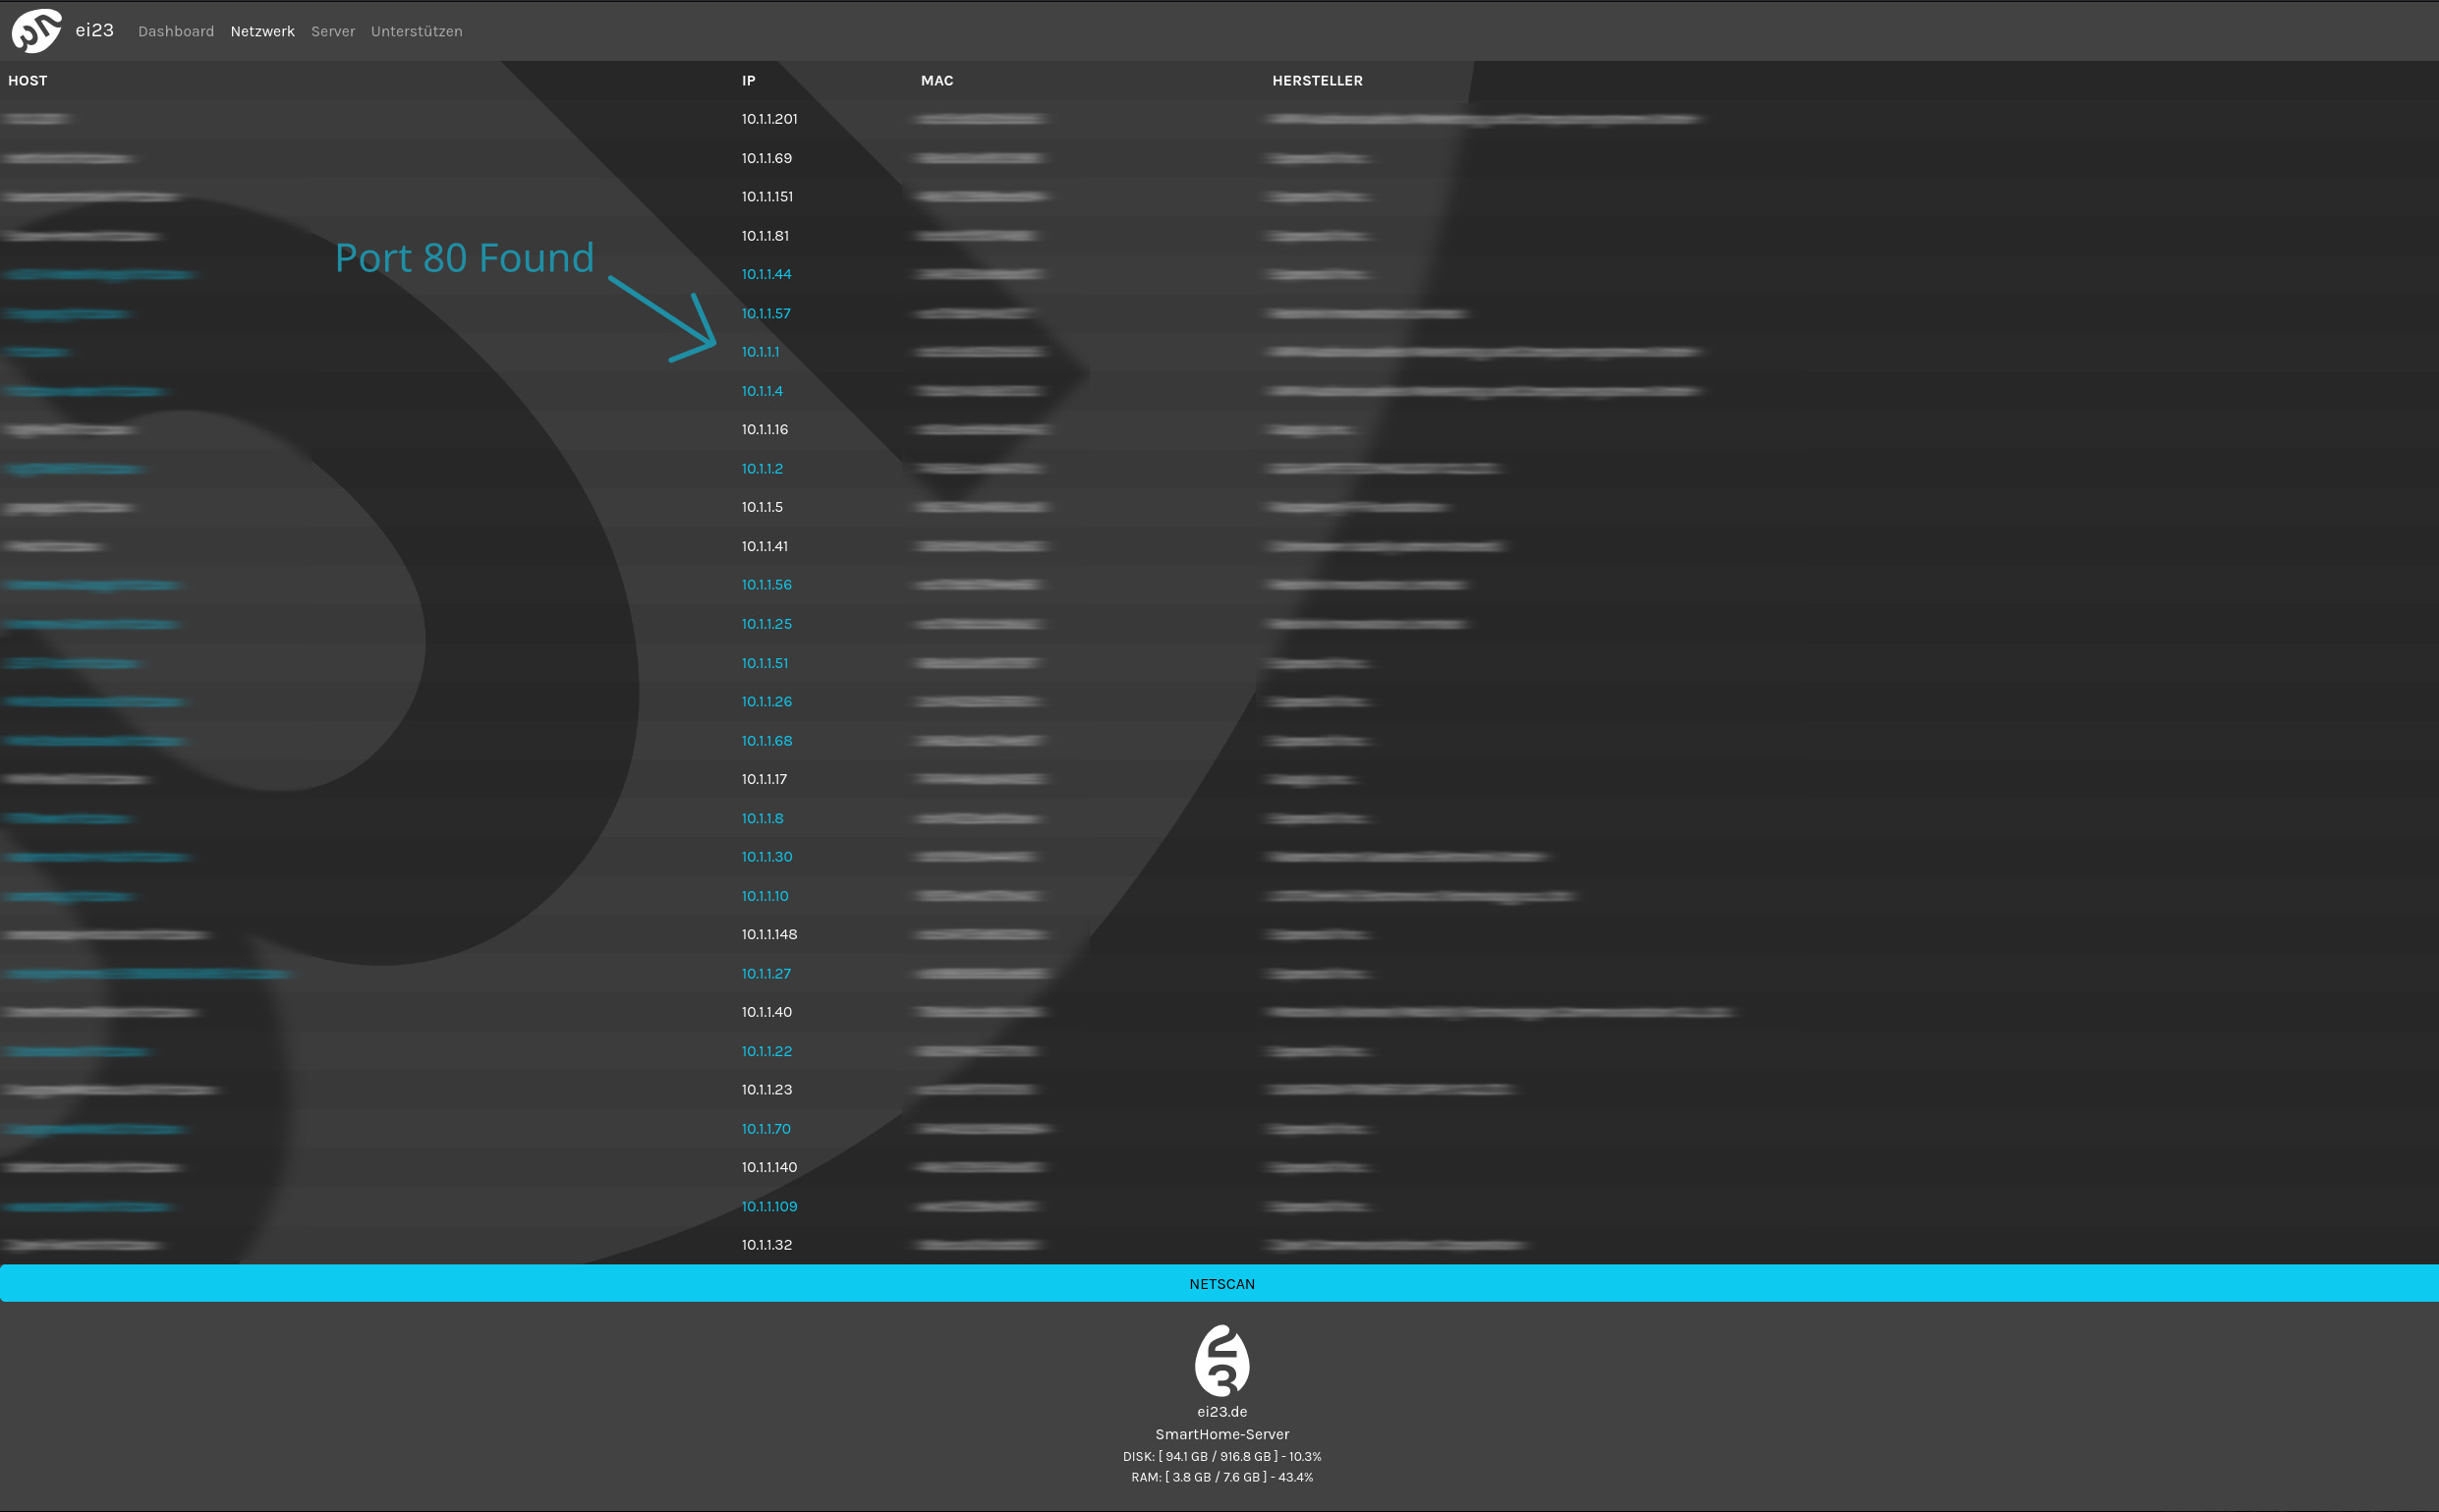
The network scanner shows all devices on the local network:
- Hostname - Device name (if resolvable)
- IP Address - Directly linked when web interface detected
- MAC Address - Hardware address
- Vendor - Device manufacturer
HTTP Detection
When a device has port 80 open, it's highlighted in blue and the IP is directly linked.
Click "Scan" to rescan the network.
Storage Page (/tree)
Shows disk usage by folders - useful for finding large directories.
Configuration
Change Port
Create/Edit /home/[user]/ei23-docker/volumes/ei23/config.ini:
Then restart the supervisor:
Check Status
Notes
- The dashboard runs as a Python-Flask server with Waitress
- The service starts automatically on boot (
ei23.service) - The dashboard is accessible on port 80 (configurable)
- Program icons are located at
/home/[user]/ei23-docker/volumes/ei23/web/static/img/ - Custom icons: 128x128 PNG with transparent background